How is Medicaid funded?

In this article
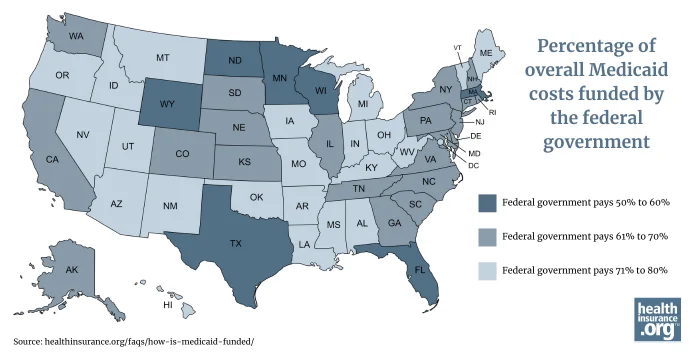
Do Medicaid funding levels vary depending on the state?
In every state, Medicaid programs are funded jointly by the state and by the federal government, but there is significant variation from state to state in terms of how the costs are split between the state and federal governments.
Medicaid, which provided health coverage to more than 71 million people in the United States as of December 2024,1 is administered by the states and jointly funded by the state and federal governments.2
But the funding split between the state and federal government depends on two primary factors: the average per-capita income in the state,3 and whether the state has expanded Medicaid eligibility under the Affordable Care Act (ACA).
Who receives Medicaid?
Medicaid is designed to provide coverage to various low-income populations. Historically, before the ACA’s expansion of Medicaid, that included children, pregnant women, and parents or caretakers of minor children, as well as people who are elderly or disabled and who have low incomes and limited assets.4 We’ll refer to these groups as the traditional Medicaid population.
Medicaid is now also available in most states to nearly all adults under the age of 65 with incomes up to 138% of the federal poverty level ($21,597 for an individual in the continental U.S. in 2025), due to the ACA’s expansion of Medicaid.5
The amount of federal funding a state receives depends on whether it's for the state’s traditional Medicaid population or that population plus additional individuals who are eligible due to that state’s Medicaid expansion. For this article, we’ll be looking at June 2024 enrollment data, as those are the most recent Medicaid expansion enrollment numbers available as of the time of writing. Although Medicaid covered a total of more than 73 million people in June 2024,6 it’s important to understand how that was divided across the two categories:
- Nearly 20.3 million low-income adults were covered due to Medicaid expansion.7 This was about 28% of the total Medicaid population. (In addition, almost 650,000 people were enrolled in expanded Medicaid in the U.S. territories.8 But the ACA’s enhanced federal funding for Medicaid expansion – described below – does not apply in the territories.)9
- More than 53 million people – the other 72% of the Medicaid population10 – were in the traditional eligibility groups.
Funding for traditional Medicaid
Funding for traditional Medicaid is split between the states and the federal government using a formula that provides more federal funding in states with lower per-capita incomes.3 The federal government’s share of the cost is referred to as the Federal Medical Assistance Percentage (FMAP).
There’s a statutory FMAP minimum of 50%, meaning that regardless of how high a state’s per-capita income might be, the federal government will pay at least 50% of the cost of covering the state’s traditional Medicaid population. This minimum FMAP is used in ten states as of 2025.11
The statutory FMAP maximum is 83%, but in 2025, the state with the highest federal Medicaid funding is Mississippi, where the federal government pays 76.9% of the cost of traditional Medicaid.3 (The 83% federal funding rate is used in some of the U.S. territories.)11
So in the ten states that have an FMAP of 50%, the federal government and the state government equally split the cost of covering the traditional Medicaid population. But in Mississippi, the state pays 23.1% of the cost, while the federal government pays 76.9% of the cost.
Funding for Medicaid expansion states
Medicaid expansion is optional for states, due to a 2012 Supreme Court ruling.12 Forty states and the District of Columbia have implemented Medicaid expansion as of 2025.5
In those states – as called for in the ACA – the federal government pays 90% of the cost of covering the Medicaid expansion population.13
Overall federal funding when a state has expanded Medicaid
So if a state has expanded Medicaid, the overall FMAP will be higher than the FMAP that applies to the traditional Medicaid population. This is because you have to account for the fact that the FMAP is 90% for the Medicaid expansion population.
To understand how this works, we can look at North Carolina as an example, using enrollment data from June 2024:
- Total Medicaid enrollment = 2,394,47014
- Medicaid expansion enrollment = 480,8368
- Traditional Medicaid enrollment = 1,913,634 (total minus Medicaid expansion)
- Traditional Medicaid FMAP = 65.06%11
So about 20% of North Carolina’s Medicaid population is in the expansion group, with a 90% FMAP. The other 80% is in the traditional group, with a 65.06% FMAP.
If we total that up (multiply 0.2 by 0.9, multiply 0.8 by 0.6506, and add the two results together), we end up with an overall FMAP of about 70%. That means if we look at North Carolina’s entire Medicaid population, the federal government funds about 70% of the cost, and the state funds about 30%.
Contrast that with states where Medicaid hasn’t been expanded: In those states, there is no Medicaid expansion population and no 90% FMAP. As a result, the traditional Medicaid FMAP is used for the entire Medicaid population.
Here’s how that math works out for each state, rounded to the nearest whole number:
Composite FMAP by state |
|||
|---|---|---|---|
| State | Composite FMAP | State | Composite FMAP |
| Wyoming | 50% | North Carolina | 70% |
| Florida | 57% | South Carolina | 70% |
| Minnesota | 60% | Vermont | 71% |
| Massachusetts | 60% | Hawaii | 71% |
| North Dakota | 60% | Maine | 71% |
| Texas | 60% | Utah | 71% |
| Wisconsin | 60% | Ohio | 71% |
| South Dakota | 61% | Iowa | 72% |
| Maryland | 62% | Missouri | 72% |
| Illinois | 62% | Nevada | 73% |
| Kansas | 62% | Montana | 73% |
| Alaska | 63% | Arizona | 73% |
| Colorado | 64% | Indiana | 73% |
| Connecticut | 64% | Michigan | 73% |
| New Hampshire | 64% | Oklahoma | 73% |
| New Jersey | 64% | Alabama | 73% |
| New York | 64% | Idaho | 75% |
| Washington | 64% | Oregon | 76% |
| Pennsylvania | 65% | Arkansas | 77% |
| Nebraska | 65% | Mississippi | 77% |
| Tennessee | 65% | Kentucky | 79% |
| California | 66% | New Mexico | 79% |
| Rhode Island | 66% | Louisiana | 80% |
| Georgia | 66% | District of Columbia | 80% |
| Virginia | 67% | West Virginia | 80% |
| Delaware | 69% | ||
Note that these numbers are approximations, as we have not taken into account the various FMAP exceptions that apply in some circumstances, such as adjustments for disaster recovery, or for children with medically complex conditions.15
Where does state Medicaid funding come from?
As noted above, states and sources other than the federal government pay roughly 20% to 50% of the cost of providing Medicaid to eligible residents. Nationwide, about two-thirds of state Medicaid funding comes from states’ general funds, generated from income and sales taxes. The remaining third comes from other sources, including provider taxes and funding from local governments.16
Provider taxes are a controversial source of state Medicaid funding. This is because states can “inflate their effective federal match” by taxing providers (mostly hospitals and nursing facilities)16 to raise revenue to pay state Medicaid costs, but also by increasing payments to those same providers. This allows the state to report higher Medicaid costs, resulting in additional federal funding, without increasing overall state spending.17
The budget reconciliation bill passed by the House of Representatives in May 202518 would allow states to keep existing Medicaid provider taxes in place, but would prohibit states from implementing new provider taxes or increasing existing provider taxes.19
This is controversial however, because opponents of the freeze on Medicaid provider taxes note that it could result in state budget shortfalls. Addressing that would require states to either raise taxes to generate more revenue, or reduce state spending on Medicaid by cutting eligibility and/or benefits, or reducing payments to Medicaid providers.16
Can Medicaid funding be changed?
Yes, Congress can make changes to the way Medicaid is funded. This could include adjustments to the FMAP for traditional Medicaid (for example, removing the 50% minimum)20 or changes to the FMAP that applies to the Medicaid expansion population.21
For example, the budget reconciliation bill that the House passed in May 2025 calls for the expansion FMAP to be reduced to 80% in states that use state funds to provide Medicaid or similar coverage to undocumented immigrants.22
Footnotes
- “December 2024 Medicaid & CHIP Enrollment Data Highlights” Medicaid.gov. Accessed May 15, 2025 ⤶
- “Medicaid Financing: The Basics” KFF.org. Jan. 29, 2025 ⤶
- “Medicaid’s Federal Medical Assistance Percentage (FMAP)” Congress.gov. Accessed Apr. 21, 2025 ⤶ ⤶ ⤶
- “Medicaid: An Overview” Congress.gov. Accessed May 15, 2025 ⤶
- “Status of State Medicaid Expansion Decisions” KFF.org. Apr. 17, 2025 ⤶ ⤶
- “State Medicaid and CHIP Applications, Eligibility Determinations, and Enrollment Data”” Medicaid.gov. Accessed May 15, 2025 ⤶
- “Medicaid Enrollment – New Adult Group” (Not counting the U.S. territories), Medicaid.gov. Data for June 2024; Accessed Apr. 22, 2025 ⤶
- “Medicaid Enrollment - New Adult Group” Medicaid.gov. Data for June 2024; Accessed Apr. 22, 2025 ⤶ ⤶
- “Medicaid and CHIP in the Territories” MACPAC Fact Sheet. Feb. 2021. Accessed Apr. 24, 2025 ⤶
- “State Medicaid and CHIP Applications, Eligibility Determinations, and Enrollment Data”“” Medicaid.gov. Accessed May 15, 2025 ⤶
- “EXHIBIT 6. Federal Medical Assistance Percentages and Enhanced Federal Medical Assistance Percentages by State, FYs 2022–2025” MACPAC. Accessed Apr. 22, 2025 ⤶ ⤶ ⤶
- “A Guide to the Supreme Court’s Decision on the ACA’s Medicaid Expansion” KFF.org. Aug. 1, 2012 ⤶
- “Medicaid’s Federal Medical Assistance Percentage (FMAP) (FMAP Rate for ACA Medicaid Expansion)” Congress.gov. Accessed Apr. 21, 2025 ⤶
- “State Medicaid and CHIP Applications, Eligibility Determinations, and Enrollment Data” Medicaid.gov. Accessed May 15, 2025 ⤶
- “Medicaid’s Federal Medical Assistance Percentage (FMAP) (FMAP Exceptions)” Congress.gov. Accessed Apr. 24, 2025 ⤶
- “5 Key Facts About Medicaid and Provider Taxes” KFF.org. Mar. 25, 2025 ⤶ ⤶ ⤶
- “Medicaid Provider Taxes Inflate Federal Matching Funds” Committee for a Responsible Federal Budget. Sep. 28, 2023 ⤶
- "H.R.1 - One Big Beautiful Bill Act" Congress.gov. Passed House, May 22, 2025 ⤶
- “Energy & Commerce Draft Would Help Limit Medicaid Gaming” Committee for a Responsible Federal Budget. May 12, 2025. And "H.R.1 - One Big Beautiful Bill Act" Congress.gov. Passed House, May 22, 2025 ⤶
- “Ways & Means Committee potential savings ideas” W&M Committee. Accessed Apr. 2, 2025 ⤶
- “Eliminating the Medicaid Expansion Federal Match Rate: State-by-State Estimates” KFF.org. Feb. 13, 2025 ⤶
- "H.R.1 - One Big Beautiful Bill Act" (Section 44111) Congress.gov. Passed House, May 22, 2025 ⤶