Critics of the Affordable Care Act have been trying to have it both ways. On the one hand, they're screaming bloody murder about Obamacare "messing up everything for the whole country!" On the other hand, they're also trying to ridicule the law for "only enrolling 7 million people out of over 300 million!!" (their inaccurate phrasing, not mine).
The angle they're playing here is to accuse the law of "screwing up" 300 million people's health plans for the sake of a "handful" of people who have the audacity to either not have much money, have pre-existing medical conditions or both.
At the same time, Republican/conservative pundits and from FOX News, Reason and so forth have already breathlessly pounced all over my "dipped below 7M" post from Thursday as evidence that "Obamacare is falling apart at the seams!" or whatever the hyperbole of the day is. Coming immediately on top of the midterm election results, which were pretty devastating for Democrats across the board, this no doubt feels like salt in the wound to ACA supporters.
Looking beyond QHPs
It's important to understand, though, that as much as I've obsessed with the exchange QHP (qualified health plan) data over the past year, that's only a small part of the ACA story. I cannot stress this enough: Knowing whether the number is 8 million, 7 million or 13 million at any given time is important for several reasons (both functional as well as image-wise), but it's just one factor out of many which will ultimately determine how successful the ACA is overall.
To illustrate this point, I've put together two pie charts which (crudely, I admit) give an idea of the rough breakdown of health insurance coverage in the U.S. prior to the ACA being passed/implemented and as of now. A few caveats:
- Some of the numbers are either composite figures based on several slightly varying sources, or educated guesstimates.
- Sources include the Kaiser Family Foundation, the Census Bureau, and the HHS Department.
- Yes, there's a lot of rounding involved; this isn't meant to be a precise breakdown.
Before the ACA ...
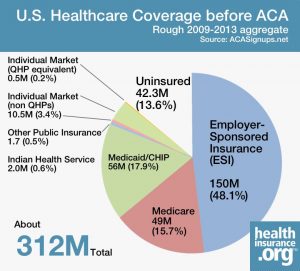 So, here we go. First, here's the rough situation from just before the Affordable Care Act was passed through about a year ago (again, these bounced around slightly over those years, so the numbers shown are basically average estimates):
As you can see, out of around 312 million total U.S. residents, just shy of half the population had employer-based health coverage (including TRICARE, federal/state employees, etc.), with Medicare and Medicaid making up another third of the country.
Subtract another 4 million covered through the Indian Health Service and other oddball public healthcare programs, and you're left with around 11 million people enrolled on the private individual market (i.e., signing up for Blue Cross/Aetna/etc. directly), and around 42 million not covered whatsoever.
... and after
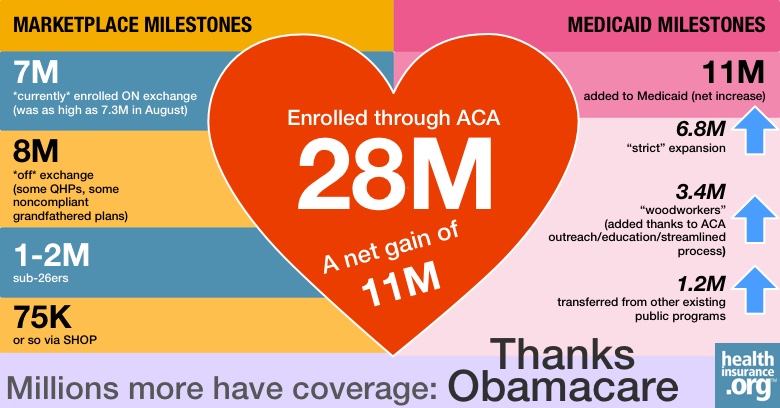
These 53 million people (11M + 42M) are the ones that the ACA has the most dramatic, obvious impact on, so let's look at the results so far:
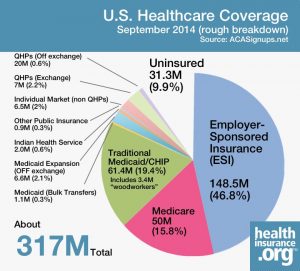
First, note that the total population has gone up a few million over the past four years. ESI and Medicare enrollment should be roughly the same, give or take a million or two. Otherwise, the major changes since the ACA's provisions kicked in have been:
- Coverage through Medicaid has gone up from around 17.9 percent of the total to around 21.8 percent – when you add in ACA expansion and ACA "woodworkers."
- Coverage in the individual health insurance market has gone up from around 3.5 percent to around 4.9 percent – when you include both ACA exchange and off-exchange policies.
- The total number of uninsured in the U.S. has dropped from around 13.6 percent to around 9.9 percent.
A 'magic number' that doesn't matter
And by the way, there never was a "magic number" in the first place. The earth wasn't going to open up and swallow the nation whole if QHPs didn't happen to cross the 7 million mark. That was an estimate that the CBO came up with a year and a half ago as to how many people they thought were likely to enroll in the first year.
They never said "if this doesn't happen, the law fails." Former HHS Secretary Sebelius made an unfortunate choice of words in an interview which made it sound like "7M OR BUST!!" was the order of the day, and the media ran with it.
And I was as guilty as anyone of making "Will they break 7 million?" seem like a make-or-break event, but I only did this once that mindset had already been set in stone anyway. (It makes for a fun, dramatic horse race, but from a strict financial/actuarial analysis POV, it would be better to have, say, 4 million healthy people enrolled than 10 million sickly ones.)
Seeing the biggest picture possible
The bottom line is that again, you have to look at the broader picture. Take another look at that pie chart. Notice that the uninsured slice has dropped by around 26 percent in just the first year of the exchanges/Medicaid expansion being operational.
That's one of the two primary goals of the law: to make sure that everyone (or at least as many as possible) is covered, and that was never intended to be a one-year accomplishment. Lopping the number down by one-fourth in the first year seems pretty good to me so far.
In short, there's no cause for alarm in a 7 million figure - or even a slightly lower number. The only serious potential problems I'm seeing for the ACA at the moment are a) potential serious technical problems during open enrollment (#OE2); b) the possible outcome of the upcoming SCOTUS Halbig/King ruling; and c) the Republican-controlled Congress continuing its death-by-a-thousand-cuts campaign (which will be redoubled now that Republicans control the Senate as well as the House).
It's not just the actual enrollment numbers themselves.
Charles Gaba is the founder of https://acasignups.net/, which has been live-tracking Obamacare enrollments since the exchanges launched in October 2013. His work has been cited by major publications from the Washington Post and Forbes to the New York Times as being the most reliable source available for up-to-date, accurate ACA enrollment data in the country.