Billions in ACA rebates show 80/20 Rule’s impact
Medical loss ratio requires carriers to devote the majority of premium revenue to enrollees' medical care

In this article
- Health insurers sent more than $1.6 billion in rebates to consumers in 2025, bringing 14-year total to about $14.3 billion
- Rebate amounts vary considerably by state and insurer
- For people who get a premium subsidy, rebate amounts can exceed net premiums
- How the MLR requirement and rebates work
- Total rebates sent to consumers in each state in 2025
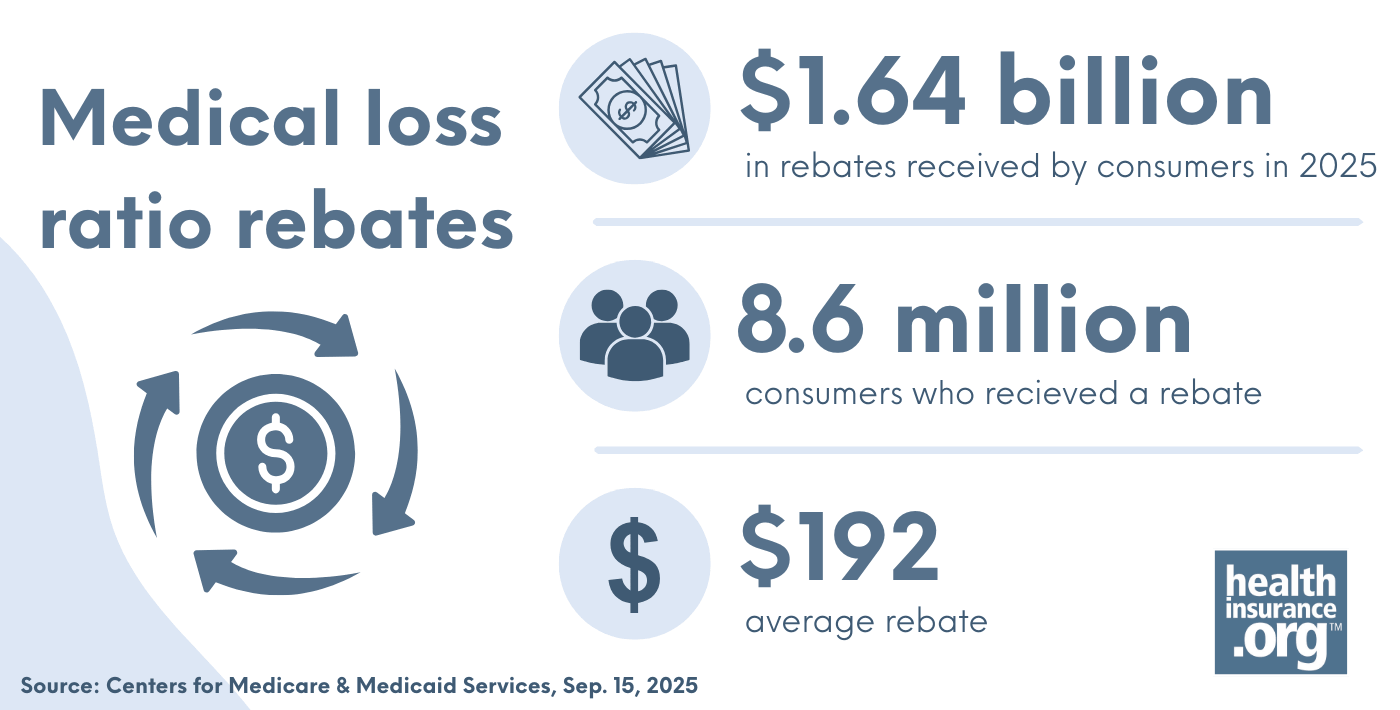
In the 14th year of MLR rebates, the rebate checks in 2025 amounted to more than $1.6 billion
Since 2012, millions of Americans have received rebates from their health insurers, refunding portions of prior-year premiums that were essentially too high.
It’s all thanks to the Affordable Care Act’s medical loss ratio (MLR), which requires health insurance companies to use your premium dollars to pay for health care and quality improvements for plan participants, or return that money to you (or your employer, if your employer sponsors your health coverage). Specifically, insurers in the individual and small group market must spend at least 80% of premium revenue on medical claims and quality improvements, and that rises to 85% for large group plans. So administrative costs, including profit, cannot exceed 20% or 15% of premium revenue.
In 2025, insurers were required to pay more than $1.6 billion in rebates to more than 6 million consumers.1 That was based on insurer revenue and spending for 2022-2024 (see below for a summary of each year’s total rebates). The average rebate check in 2025 was $192, but there was considerable variation from one state to another, and from one market to another (individual, small group, and large group).1
The individual market only covers about 11% of the US population,2 but it accounts for a disproportionate share of MLR rebates. In 2025, the individual market accounted for nearly 72% of the total rebate dollars that were issued. And more than 5 million of the 8.6 million consumers who received rebates were in the individual market, even though the group market is much larger.1 (Note: For the 3.5 million people enrolled in employer-sponsored plans that didn’t meet the MLR requirements, the rebates were sent to their employers, rather than to each enrollee.)
To clarify, the goal is for insurers to spend the majority of your premium dollars on medical claims so that rebates aren’t necessary – and that’s obviously working, as the vast majority of consumers do not receive MLR rebates in any given year (about 8.6 million people received rebate checks in 2025). But given that insurers set premiums a year in advance, it’s not always possible to accurately project membership (and thus revenue) and claims costs. So the rebates serve as a backstop, ensuring that even if premiums are ultimately set too high in a given year, the MLR rules still apply.
Although ensuring that the bulk of premium revenue is spent on non-administrative costs is a laudable goal, there are concerns that the MLR’s design does little to drive down health care prices or limit premium increases over time, as insurers can simply respond to increasing claims costs by raising premiums.3
Rebates vary by state and by insurer
To be clear, most people do not receive an MLR rebate check. This is because most insurers tend to comply with the MLR requirements, and because the MLR rules don’t apply to self-insured plans,4 which cover the majority of people with employer-sponsored health insurance.5
Every year, there are some states where no rebates are issued (meaning all of the insurers in that state hit the MLR targets; this was the case in nine states in 2025).1 And even in states where MLR rebates are issued, they’re usually only sent out by a few insurers.6
For subsidized enrollees, rebate amounts can exceed net premiums
MLR rebates are paid to policyholders. In the case of employer-sponsored plans, the rebates are sent to the employer (who can pass them on to employees or use the money to reduce employees’ future premiums or provide enhanced benefits). In the case of individual market plans, the rebate is sent to the individual who purchased the plan. The rebate amount is based on the full cost of the plan, regardless of how much of that cost was offset by a premium subsidy.
So even if the enrollee paid very little (or nothing at all) in premiums due to their subsidy, they receive the full amount of the rebate check if their insurer didn’t comply with the MLR rules.3
The short story is that the rebate amounts might not seem “fair” at all. A person who paid very little in after-subsidy premiums might receive a significant rebate check, while their neighbor might receive no rebate check at all – even if they weren’t eligible for a subsidy and had to pay what seemed an exorbitant monthly premium – because they were enrolled in a plan that met the MLR requirements. To reiterate, most Americans do not receive a rebate check. And the relative affordability of a person’s premiums has little to no bearing on whether they’ll end up receiving a rebate check.
How do MLR rebates work?
The MLR rebates are tied to the medical loss ratio: The percentage of insurance premium dollars spent on actual health care – as opposed to marketing, profits, CEO salaries, and other administrative expenses. If an insurer spends less than 80% of individual and small-group plan premiums (85% for large-group plans) on providing medical care, they must rebate the excess dollars back to plan members and employers via checks that are sent to consumers each fall.7
MLR rebates are calculated at the insurer level for each of the three market segments (individual, small group, and large group), and on a state-by-state basis. An insurer’s aggregate numbers in each of those markets are considered to determine whether rebates are necessary. If they are, they apply to everyone who had coverage under that insurer’s plans in that market segment in that state – it’s not broken down on a plan-by-plan basis beyond that. However, the exact amount of each policyholder’s rebate is based on the (pre-subsidy) premiums for the plan that person had.
So if an insurer offers several different plans in the individual market and the aggregate MLR across all of those plans is under 80%, the insurer will owe rebates to everyone enrolled in those plans. But people with higher-priced plans (including older people, people who selected richer-benefit coverage, and people in higher-priced areas of the state) will get larger rebates than people with lower-priced plans, since the rebate is calculated as a percentage of the premium.
The rebates that are sent out each fall are based on the average MLR for the prior three years.8 So the rebates that were sent out in 2025 were based on each carrier’s average MLR for 2022-2024.
The majority of very large employers self-insure their employees’ health coverage, and MLR rules do not apply to self-insured plans.9 Initially, there were also exemptions for non-profit insurers, although they had to begin complying with the MLR requirements in 2014. Some states received CMS approval to modify MLR requirements within the state in the early years,10 but there are no longer any states with MLR requirements that are lower than the federal rules (Massachusetts has a much higher MLR requirement at 88% for individual and small group plans;11 New York’s is 82%.12)
How much has been paid out in MLR rebates since the program began?
Since MLR checks first began to be paid out in 2012, insurers have rebated about $14.3 billion to consumers. Here are the total rebate amounts by year:13
- $1.1 billion in 2012 (based on 2011 MLR, as the rule became effective that year)
- $504 million in 2013
- $332 million in 2014
- $469 million in 2015
- $397 million in 2016
- $447 million in 2017
- $707 million in 2018
- $1.37 billion in 2019
- $2.46 billion in 2020
- $2.01 billion in 2021
- $1.03 billion in 2022
- $947 million in 2023
- $958 million in 2024
- $1.6 billion in 2025
There were several states where no rebates were sent in 2025 (meaning all the insurers in the state were compliant with the MLR requirements). But in most states, at least some consumers received rebate checks in 2025, as had been the case in prior years. Here are the data for the rebates that insurers sent out in the fall of 2025:1
| State | Total Rebates (including individual, small group, and large group markets) | Number of consumers who received a rebate
|
Average rebate amount
|
| USA | $1,640,091,858 | 8,558,274 | $192 |
| Alaska | $0 | 0 | $0 |
| Alabama | $181,950,179 | 298,339 | $610 |
| Arkansas | $33,352,224 | 90,236 | $370 |
| Arizona | $10,172,912 | 56,069 | $181 |
| California | $31,167,747 | 505,843 | $62 |
| Colorado | $11,596,239 | 158,406 | $73 |
| Connecticut | $1,583,672 | 1,627 | $974 |
| District of Columbia | $65,628 | 390 | $168 |
| Delaware | $74,534 | 199 | $375 |
| Florida | $91,197,982 | 1,239,089 | $74 |
| Georgia | $24,173,251 | 527,739 | $46 |
| Hawaii | $3,728,901 | 1,658 | $2,254 |
| Iowa | $7,255,919 | 43,576 | $167 |
| Idaho | $1,625,416 | 29,837 | $54 |
| Illinois | $4,761,075 | 79,768 | $60 |
| Indiana | $66,147,241 | 242,147 | $273 |
| Kansas | $6,224,665 | 7,561 | $823 |
| Kentucky | $1,684,980 | 24,425 | $69 |
| Louisiana | $130,147,819 | 307,104 | $424 |
| Massachusetts | $75,616,534 | 380,957 | $198 |
| Maryland | $33,125,162 | 314,059 | $105 |
| Maine | $174,838 | 462 | $379 |
| Michigan | $11,718,564 | 149,814 | $78 |
| Minnesota | $0 | 0 | $0 |
| Missouri | $156,356,470 | 535,511 | $292 |
| Mississippi | $3,711,031 | 14,732 | $252 |
| Montana | $0 | 0 | $0 |
| North Carolina | $99,695,252 | 354,047 | $282 |
| North Dakota | $0 | 0 | $0 |
| Nebraska | $5,344,361 | 97,183 | $55 |
| New Hampshire | $8,706,576 | 80,282 | $108 |
| New Jersey | $22,827,461 | 88,770 | $257 |
| New Mexico | $5,285,688 | 12,706 | $416 |
| Nevada | $32,620,323 | 218,818 | $149 |
| New York | $8,964,289 | 356,615 | $25 |
| Ohio | $78,900,931 | 307,753 | $256 |
| Oklahoma | $88,703,731 | 126,200 | $703 |
| Oregon | $0 | 0 | $0 |
| Pennsylvania | $55,729,203 | 411,845 | $135 |
| Rhode Island | $0 | 0 | $0 |
| South Carolina | $138,197,855 | 399,052 | $346 |
| South Dakota | $0 | 0 | $0 |
| Tennessee | $16,054,530 | 98,972 | $162 |
| Texas | $126,713,875 | 432,262 | $293 |
| Utah | $950,864 | 5,749 | $165 |
| Virginia | $43,219,764 | 358,145 | $121 |
| Vermont | $0 | 0 | $0 |
| Washington | $926,512 | 11,050 | $84 |
| Wisconsin | $17,672,651 | 186,402 | $95 |
| West Virginia | $0 | 0 | $0 |
| Wyoming | $1,955,005 | 2,876 | $680 |
The numbers above are statewide averages. CMS has a further breakdown by individual, small group, and large group markets.
GOP tried unsuccessfully to repeal the federal MLR rules in 2017, but MLR requirements appear to be here to stay
While the MLR provision has obvious appeal to consumers, it isn’t universally loved14 – and was among the ACA provisions in Republicans’ crosshairs as they attempted to repeal the ACA in 2017. The Senate’s 2017 Better Care Reconciliation Act (BCRA) would have eliminated the federal requirement that insurers spend the majority of premiums on health care. (That measure did not pass the Senate when it was introduced as a substitute for H.R. 1628 in July 2017.)
Under the BCRA, states would have become responsible for regulating insurers’ administrative costs. This is similar to the approach that the Trump administration has taken regarding insurers’ network adequacy15 (the Biden administration strengthened network adequacy rules by only allowing state oversight if the state’s requirements were at least as stringent as federal rules,16 but the Trump administration has reverted to state oversight of network adequacy starting with the 2027 plan year).17 And it’s in keeping with the GOP belief that regulatory authority should be concentrated at the state – rather than federal – level.
The Congressional Budget Office estimated that about half the U.S. population lives in states where the current federal MLR rules would have been maintained if the BCRA had been implemented, and the other half live in states where the rules would have been relaxed.18 "Relaxed" rules would have led to increased premiums (and of course, smaller MLR rebates), particularly for people who don’t qualify for premium subsidies in the exchange.
As noted above, individual market rebates are sent to the policyholders, even if the bulk of their premiums were paid by the federal government via subsidies. But without an MLR requirement, insurers would be able to charge higher prices without having to worry about future rebates, and consumers who don’t qualify for subsidies would be hardest hit.
GOP efforts to repeal the ACA in 2017 were not successful, and the Supreme Court upheld the ACA in 2021, for the third time in a decade. So insurers in every state still have to spend the majority of premium revenue on medical costs and quality improvements, rather than administrative expenses.
Footnotes
- “2024 MLR Rebates by State” Centers for Medicare & Medicaid Services. Sep. 15, 2025 ⤶ ⤶ ⤶ ⤶ ⤶
- “Health Insurance Coverage in the United States: 2024” U.S. Census Bureau. Sep. 9, 2025 ⤶
- “The Unintended Consequences Of The ACA’s Medical Loss Ratio Requirement” Health Affairs. Oct. 15, 2025 ⤶ ⤶
- “Explaining Health Care Reform: Medical Loss Ratio (MLR)” KFF.org. Feb. 29, 2012 ⤶
- “2025 Employer Health Benefits Survey” KFF.org. Oct. 22, 2025 ⤶
- “Issuers Owing Rebates for 2024” Centers for Medicare & Medicaid Services. Sep. 12, 2025 ⤶
- “Medical Loss Ratio Data and System Resources” Centers for Medicare & Medicaid Services. Accessed Nov. 20, 2025 ⤶
- “2024 Medical Loss Ratio Rebates” KFF.org. June 5, 2024 ⤶
- “Medical Loss Ratio Requirements Under the
Patient Protection and Affordable Care Act (ACA): Issues for Congress” Congressional Research Service. Aug. 26, 2014 ⤶ - “State Requests for MLR Adjustment” Centers for Medicare & Medicaid Services. Accessed Nov. 20, 2025 ⤶
- “Ensuring Stability in Health Care Access and Costs: The Need for Robust Reporting and Oversight Across the Entire Health Care System” Massachusetts Association of Health Plans. Apr. 2024 ⤶
- “Insurance Circular Letter No. 15 (2011)”and “What is “medical loss ratio” or “MLR” and why does it matter?” NY Department of Financial Services. Accessed June 23, 2026 ⤶
- “Medical Loss Ratio Data and System Resources” Centers for Medicare & Medicaid Services. Accessed June 23, 2026 ⤶
- “HHS Can Target Obamacare’s Medical Loss Ratio Rule Right Away” Forbes. Apr. 17, 2017 ⤶
- “Examining The Final Market Stabilization Rule: What’s There, What’s Not, And How Might It Work? (Updated)” Health Affairs. Apr. 14, 2017 ⤶
- “Patient Protection and Affordable Care Act; HHS Notice of Benefit and Payment Parameters for 2023 (Network Adequacy (§ 156.230)” U.S. Department of Health & Human Services. May 6, 2022 ⤶
- “HHS Finalizes Sweeping Marketplace Changes (Part 3): Essential Health Benefits, Non-Network Plans, And More” Health Affairs. May 27, 2026 ⤶
- “H.R. 1628 Better Care Reconciliation Act of 2017” Congressional Budget Office. June 26, 2017 ⤶